One map of the entire water and sewer network - from inventory, through failure analysis, to the report for the authority.
GIS brings together in one place complete knowledge of the underground infrastructure: pipes, valves, hydrants, wells, pumping stations, intakes and treatment plants. Instead of scattered maps, files and knowledge kept "in people's heads" - a single reliable source, available in the browser, with no software to install.
We know them from the day-to-day work of network maintenance teams.
Paper maps, files on disks and the experience of individual employees. GIS merges this into one, always up-to-date source covering the entire network - available to every department from a single screen.
Manually picking valves from a paper map and consulting several people costs time and cuts off customers. In seconds, GIS shows which valves to close and who will lose water.
Preparing data in the K-GESUT format and industry reports is tedious, error-prone work. GIS prepares it automatically, with a completeness check before submission.
People responding to failures - who need a network map with valve isolation analysis: which valves to close and which customers will lose water.
People maintaining records and reporting to authorities - who need compliance with K-GESUT, Polish coordinate systems and GUGiK base maps.
People responsible for renovations, modernizations and multi-year budgets - who need reports on the age and condition of the assets and a reproducible network history.
Six areas in one system - Map, Inventory, Analyses, Protection zones, Editing, Reports.
Network objects over official maps and aerial imagery: orthophoto, BDOT10k topography, OpenStreetMap and a dark mode. Thematic layers with adjustable visibility and transparency.
The core of operational value. You point to the damaged section and the system returns which valves to close, the list of cut-off customers and the isolation area on the map. Failure response in seconds instead of hours.
Where water flows into a point from and where it will go, what area and how many customers a given source serves. Topology validation checks the correctness of connections - the foundation of reliable analyses.
One click opens the full record: attributes (diameter, material, year of construction, condition, data source), related objects and documents - scans, protocols and designs, virus-scanned before saving.
Every version of an object with date and author, with the ability to go back in time and preview it on the map. Changes go into an immutable log - it is always clear who changed what and when.
Editing sessions with locking of concurrent changes, diff preview and conflict detection and resolution. Objects are not deleted, only versioned and rolled back - nothing is lost.
Preparation of network data in the K-GESUT format required by the surveying authority (GUGiK), with a completeness check before submission. A statutory obligation met quickly and without formal errors.
Network inventory, age analysis, object card, maintenance schedule, renewal plan, water and sewer statement, failure report - with one click, exported to PDF, XLSX, CSV and GML.
Recording and visualization of direct and indirect protection zones around intakes together with attributes (legal basis, dates, restrictions). Support for protecting drinking-water quality and for field approvals.
What sets GIS apart from paper maps and foreign systems.
Valve isolation with a ready list of valves to close and cut-off customers is the function dispatchers look for most often - a plan in seconds instead of manual picking from a paper map.
K-GESUT, the PL-1992 and PL-2000 coordinate systems, GUGiK base maps (orthophoto, BDOT10k, EGiB, GESUT) - built in. Foreign systems require costly adaptation; here the data immediately "speaks the language" of the authorities.
You can reconstruct the network state from any point in time and account for every change. Versioning instead of deletion and a tamper-resistant log - important for audits and the cybersecurity of critical infrastructure.
GIS is part of the HydroNexis ecosystem (WMS, Control, FSM) from a single vendor. On-premise deployment on the customer's server gives full control over critical infrastructure data.
Screenshots from the GIS module deployed at a water and sewer network operator.
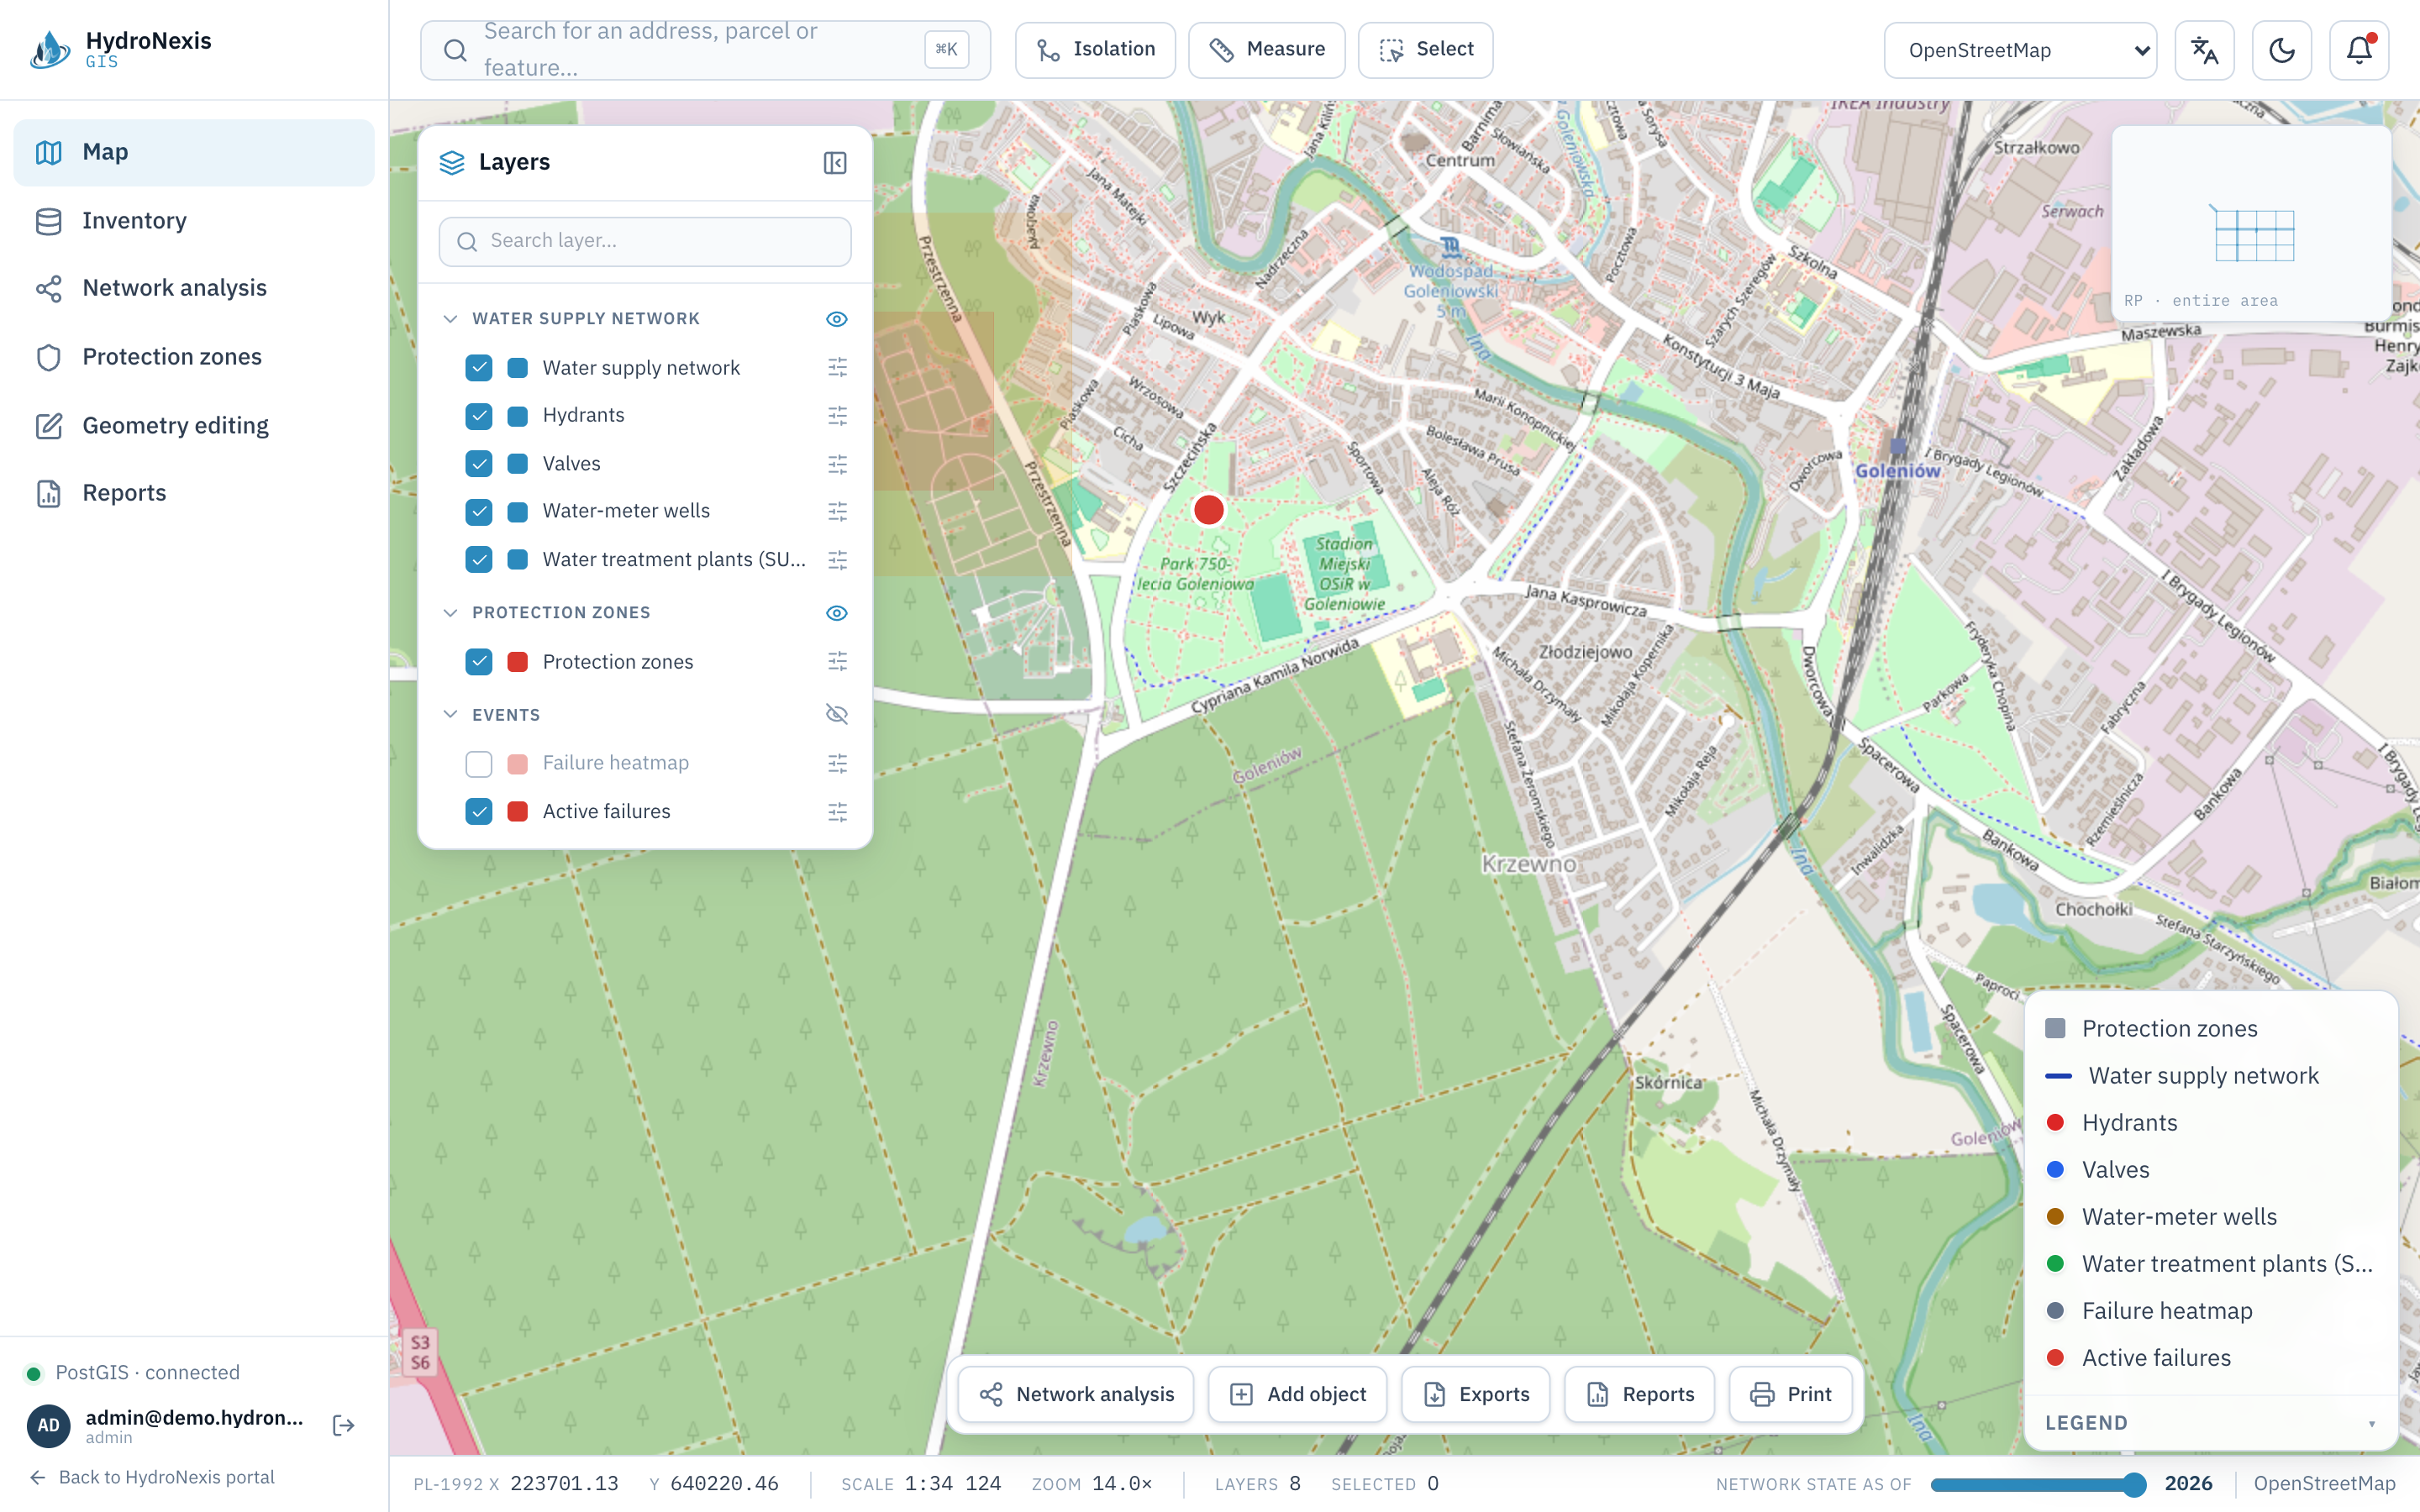
The entire water and sewer network over a base map, with a thematic layers panel (water supply network, hydrants, valves, protection zones, failures), object search and PL-1992 coordinate readout. A daily "window on the network" for every department.
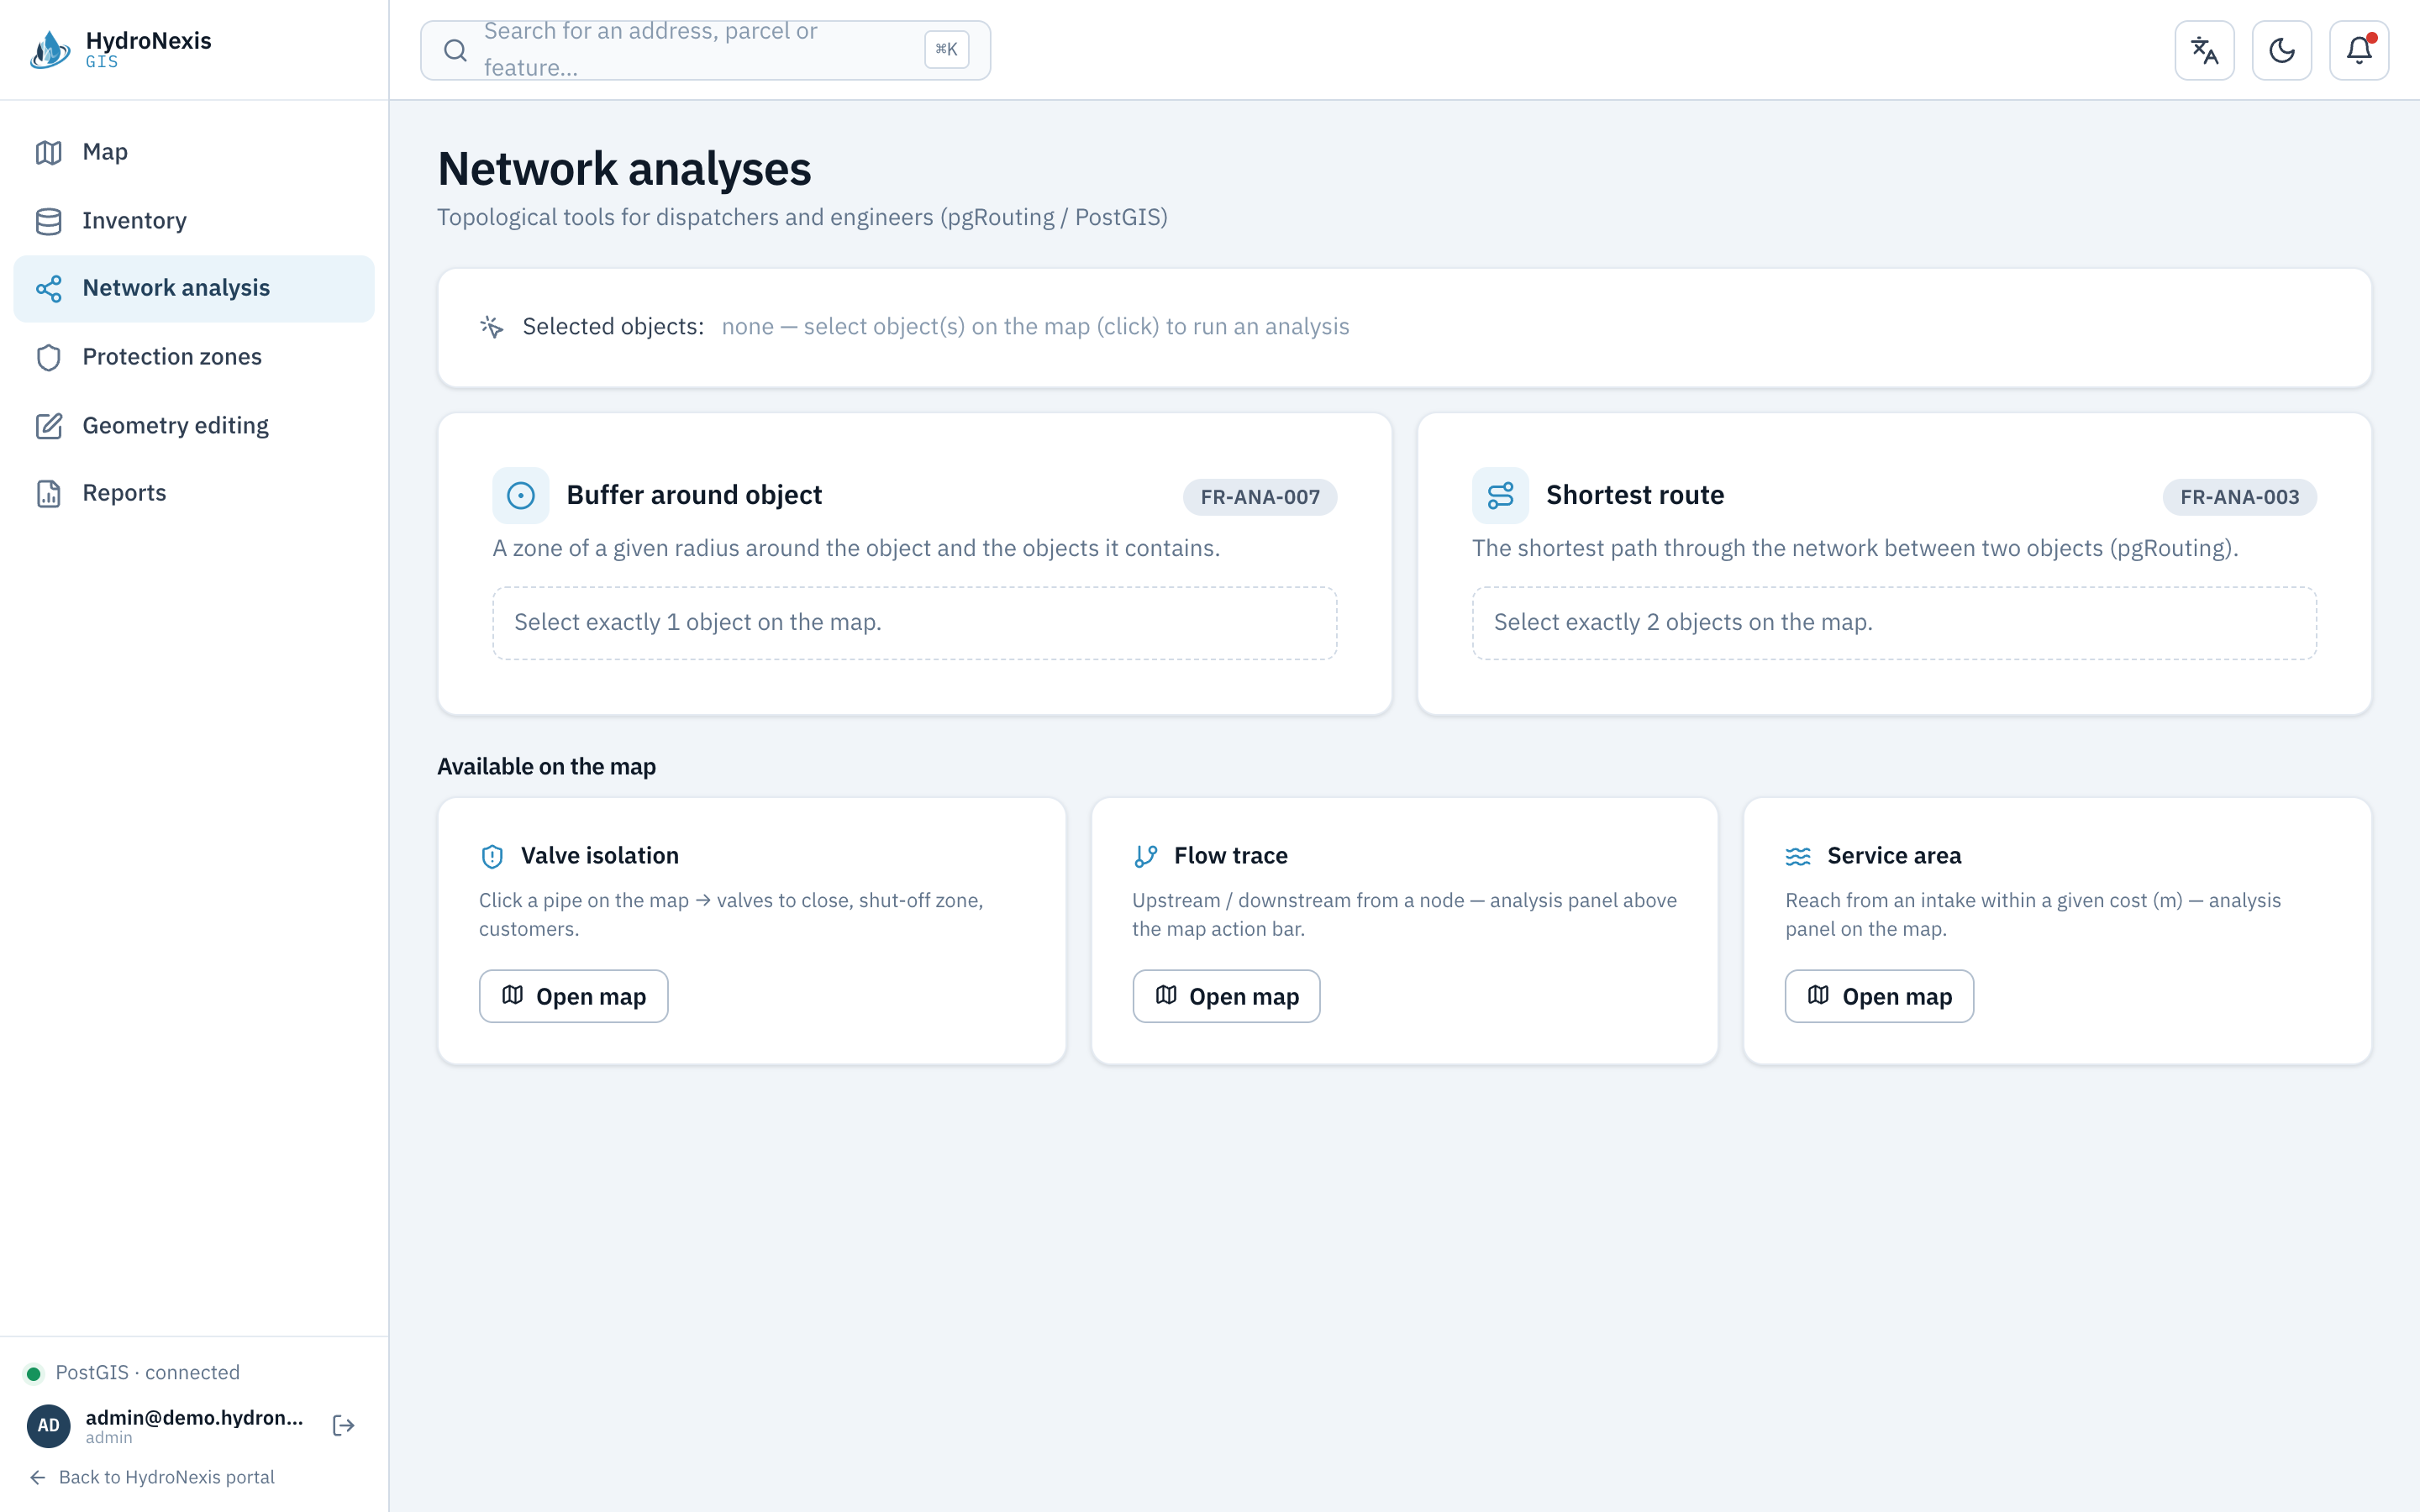
Topological tools for dispatchers and engineers: valve isolation (which valves to close), upstream and downstream flow tracing, and service area. The map becomes a decision-making tool during a failure.
GIS is the geographic core of the platform - it exchanges data with the national resource and with the other HydroNexis modules.
Generation of network data in the K-GESUT format with a completeness check before submission. A statutory obligation fulfilled without manual, error-prone work.
Orthophoto, BDOT10k topography, EGiB and GESUT as a backdrop for the network - working on current, reliable reference data without acquiring it manually.
Sharing network data externally over WFS - collaboration with surveyors and designers in QGIS without manual exports.
Linking map data with the operational data of intakes, wells and treatment plants from the WMS module - a fuller picture of water production facilities.
Loading the network from Shapefile, GeoJSON and GML files - easy migration of existing data and its ongoing updates.
Shared, secure login across the platform - one account for many modules, access restricted to the company network/VPN.
Analyses that used to take hours run in seconds. Reports and the K-GESUT export are produced with one click.
Compliance with K-GESUT and GUGiK standards, an immutable audit and versioning protect against formal errors and data loss.
Map, attributes, documents and history in one place, in the browser - a shared, up-to-date picture of the network for all departments.
Analyses show the effects of shutdowns before they are carried out, and asset age reports support investment planning.
We will show the map, failure analyses and K-GESUT export in action. No obligation.